2.7- Maps and Remote Sensing
Watch: Instructor's Video Links to an external site.
Maps
Cartography or map making is both a science and an art. Cartography is part of the Geographer's toolkit because understanding and describing location is essential to Geographers, who analyze spatial information and relationships.
Map Scale
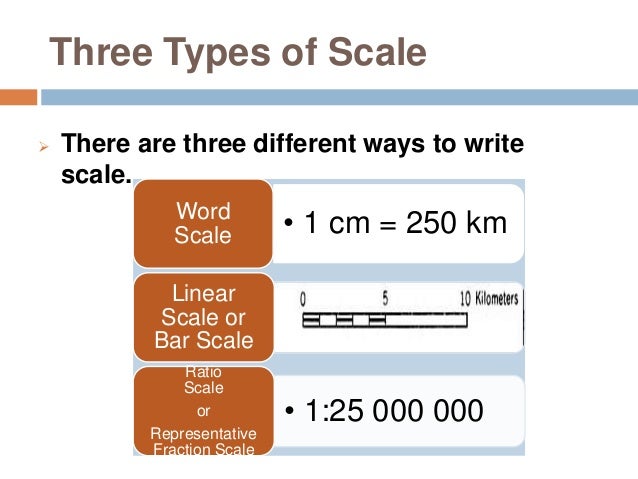 The first decision a cartographer must make is the appropriate scale for their map. Scale is the ratio of the image on a map to the real world. It relates a unit on the map to a unit in the real world. Cartographers express scale in one of three ways: a written or verbal scale, a representative fraction or a graphic scale. A verbal scale simply states the ratio: for example , "1 cm to 1 km" or "1 inch to 1 mile". A representative fraction is expressed with either a colon or a slash as in 1:125,000 or 1/125,000. No actual units are mentioned because any unit is applicable as long both sides of the fraction are using the same type of unit: 1 cm to 125,000 cm, or 1 of Cate's little finger to 125,000 of Cate's little finger. A graphic scale (or a bar scale) is a bar graph with units to allow measurement of distances physically on the map.
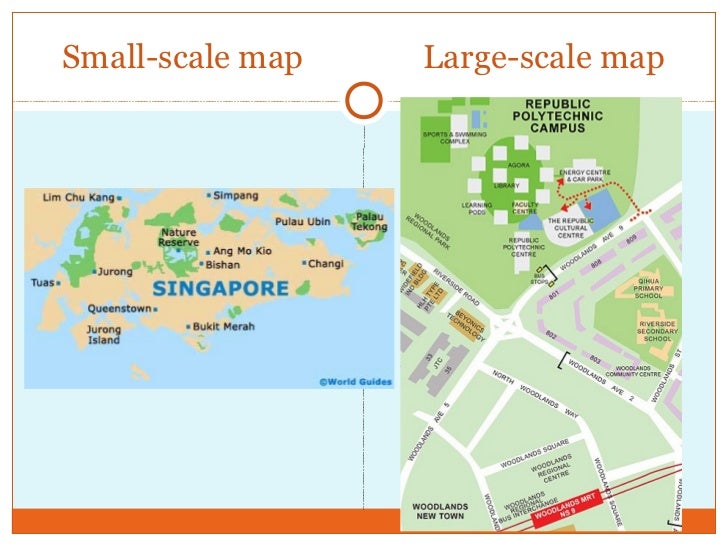
Scales are characterized as small or large depending on the ratio. Small scale maps, ironically, show MORE of the Earth's surface. Large scale maps, show SMALLER portions of the Earth. A map of the JC Campus is a very large scale map. A map of the World, on the other hand is the smallest scale map.
Map Projections
The Globe is the only accurate portrayal of the Earth. On maps, there is no way to avoid distortion. Taking a 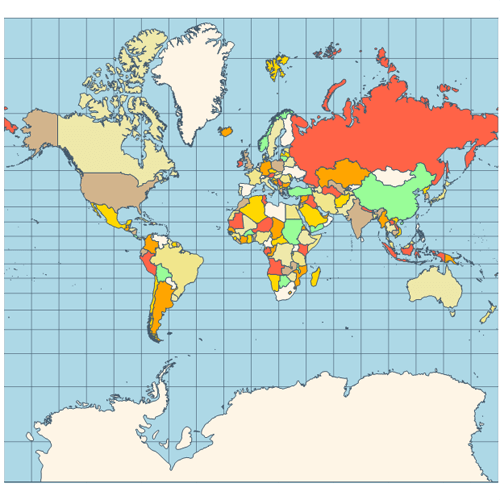 three dimensional earth and portraying it on a two dimensional map is fraught with problems. Distance, direction, area, shape - some or all of these are distorted on a two dimensional map. All maps are a compromise based on how that map will be used and by whom. Cartographers have used many different approaches to dealing with this problem. These attempts are called projections and none of them is perfect. One example of a projection is the Mercator projection which was developed in the 16th century for navigation. It's great for navigation but not so hot as a classroom map. Yet it ended up in classrooms all across the US well in to the 20th Century. The distortion of size and shape is extreme. Greenland looks bigger than Africa, Australia and South America. It's not. In fact, Greenland is smaller than Argentina alone! Antarctica looks massive. It too is not. It is a fraction of the size that it appears on this projection.
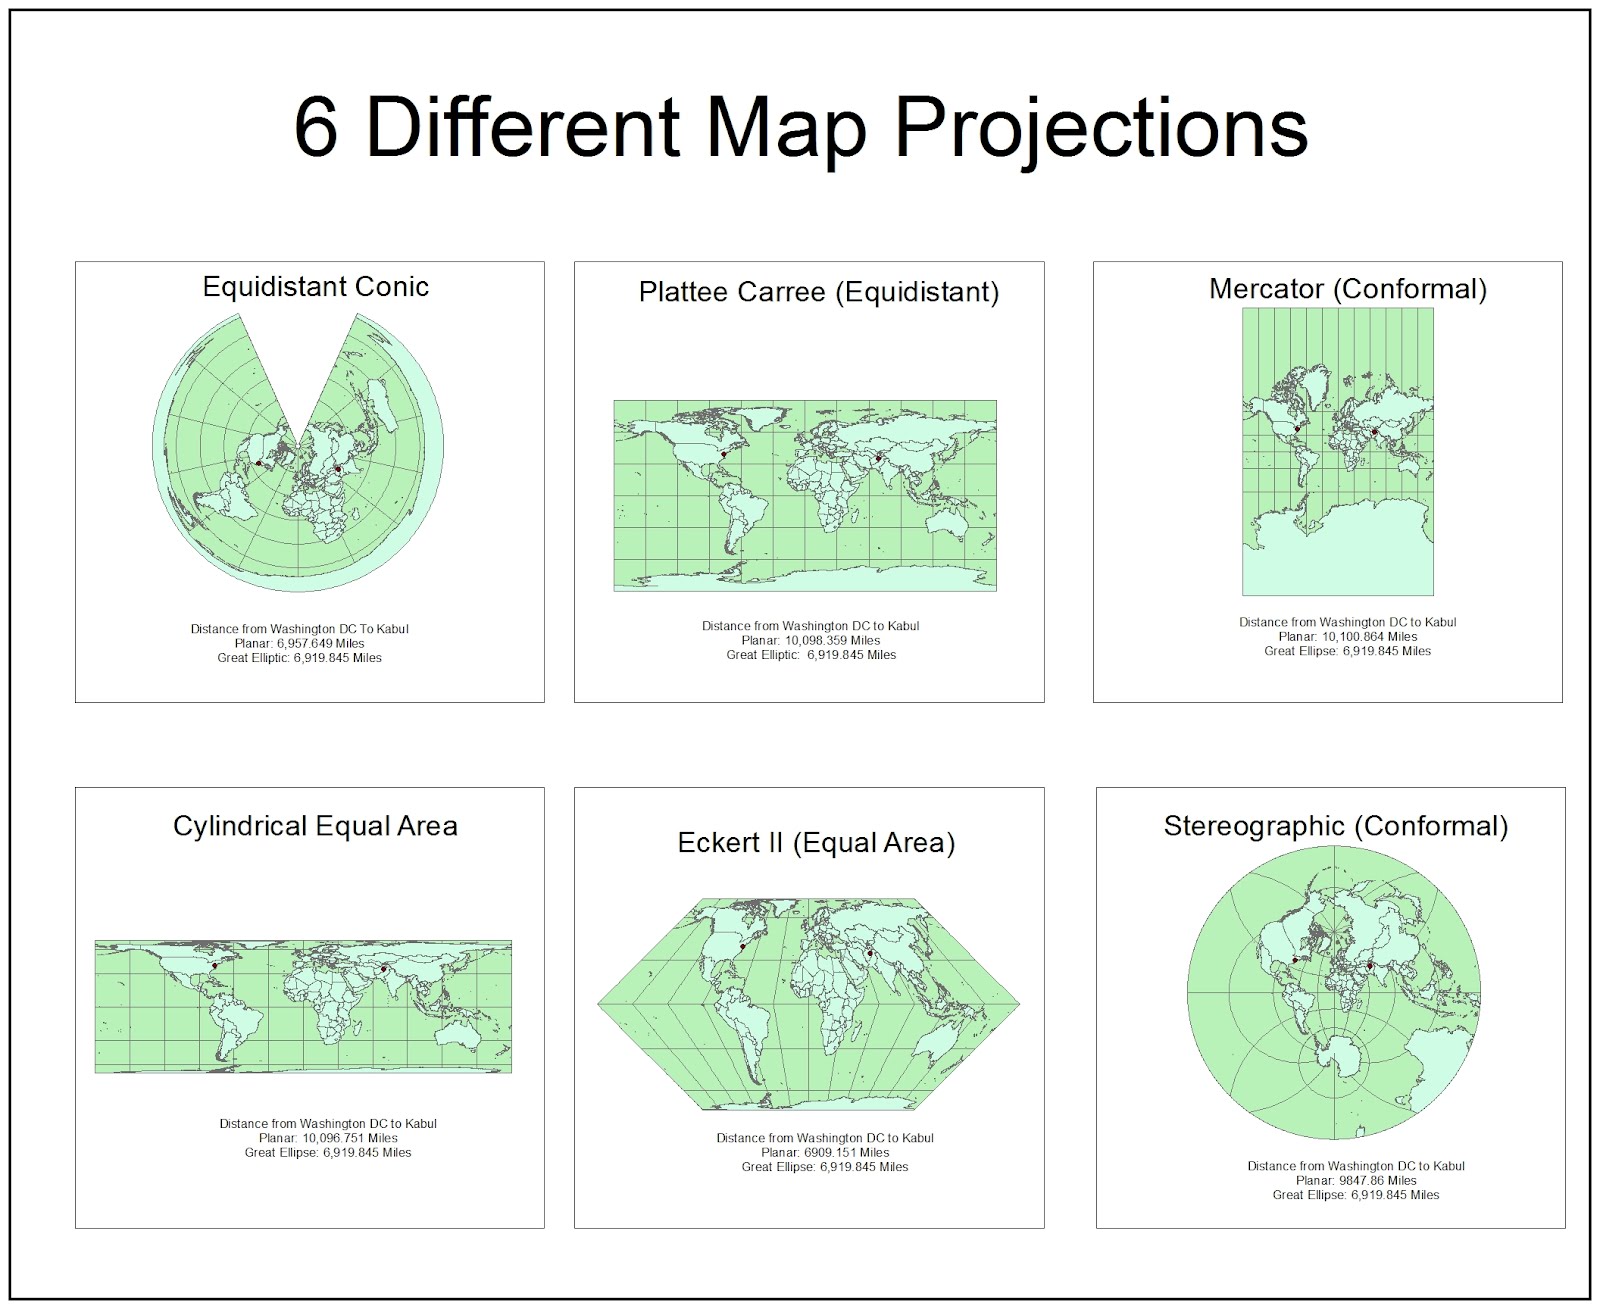
There are many other projections that cartographers use to portray the world, many of which are better suited to classroom displays than the Mercator
Isolines
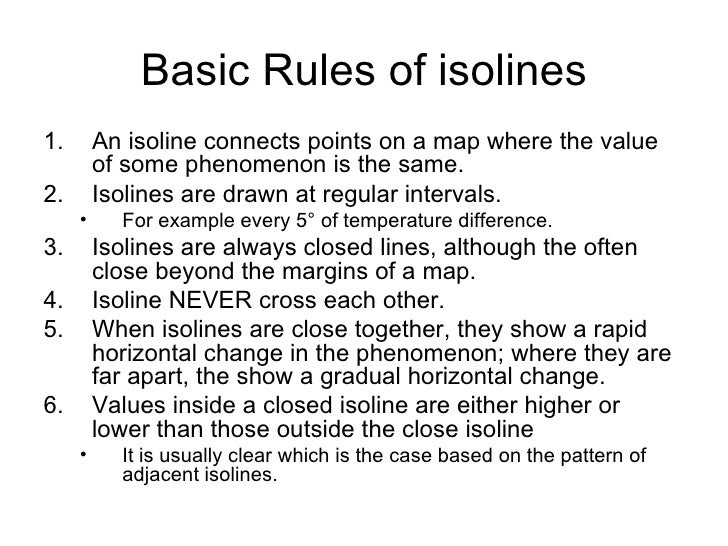
An important and commonly used tool in map- making is isolines. Isolines connect points of equal value. They are useful because they help us find patterns in what otherwise can look like a jumble of data. Some of the isolines that we will use include isobars (barometric pressure), contour lines (elevation), isotherms (temperature) and isohyets (precipitation). There are some basic rules that all isolines follow:
Later in the Semester, you will be drawing isolines in a homework assignment. This video will help you draw isolines in the future.
Watch Video: How to draw isolines
Links to an external site.
Remote Sensing
 Until the 1800's, maps were made by observation and measurements taken in the field (or by wild guessing). In the 1800's, the camera became more widely available and a very clever balloonist thought it would be interesting to bring a camera up in a balloon and take photos of Paris from high above the City. Remote Sensing was born. Remote sensing is simply the observation and/or measurement of the Earth from a remote platform. There have been many remote sensing platforms: planes, drones, satellites and my favorite, the pigeon corps
Links to an external site. . Photos have been used for direct analysis (aka spying), to create maps, and to observe phenomena for science or business. We use visible light, infrared, ultraviolet, radar and sonar to view and analyze the Earth remotely. The coolest application I know of is the use of remote sensing in Archeology
Links to an external site. .
Until the 1800's, maps were made by observation and measurements taken in the field (or by wild guessing). In the 1800's, the camera became more widely available and a very clever balloonist thought it would be interesting to bring a camera up in a balloon and take photos of Paris from high above the City. Remote Sensing was born. Remote sensing is simply the observation and/or measurement of the Earth from a remote platform. There have been many remote sensing platforms: planes, drones, satellites and my favorite, the pigeon corps
Links to an external site. . Photos have been used for direct analysis (aka spying), to create maps, and to observe phenomena for science or business. We use visible light, infrared, ultraviolet, radar and sonar to view and analyze the Earth remotely. The coolest application I know of is the use of remote sensing in Archeology
Links to an external site. .
Geographic Information Systems (GIS)

Geographic Information System (GIS) is a computer-based, data-processing tool for gathering, manipulating and analyzing geographic information. This software integrates maps, remote sensing and many other kinds of data. The JC and Sonoma State both offer courses in GIS and its a great skill to have on your resume. This video will introduce Links to an external site.you to GIS much better than I can do.
Learning More
Want to know more about Archeology from Space? Meet Sarah Parcak, the Archeologist that pioneered "space archeology". Sarah Parcak Ted Talk on Space Archeology. Links to an external site.