Pre-Lab: Microgreens and the Scientific Process
To-Do Date: Oct 2 at 11:59amAs we have seen, the process of science is an iterative process that requires all parts of the diagram below. But the heart of the process is the goal of testing ideas with evidence. Our microgreens project will be a chance to learn the basics of this process by designing and implementing test of our own.
Text description of the above graphic that explains the process of science Download Text description of the above graphic that explains the process of science
Central Core of Science:
- Goal: To build accurate explanations of the natural world.
- By: Testing ideas with evidence.
Testing Ideas:
In order to test ideas, scientists follow this general framework.
-
- Idea: You have an idea or an explanation (called a hypothesis or theory)
- Expectation/Prediction: What would you expect to see if this idea were true?
- Observation: What do you actually observe? (this is your evidence)
- Analysis: Did your expectations match your prediction? Decide if it supported your hypothesis or not.
- Community: Share you findings with other scientists for feedback and critique. Generate new ideas and start again!
How to Test Scientific Ideas: From Prediction to Observation
In order to test ideas, you will need to collect raw data from your observations and then compare the predictions and observations. Observation can be done in different ways, such as:
- Experiments
- Natural Experiments (also known as comparisons)
- Computer modeling
We will focus on experimentation for our Microgreens Project. In an experiments we manipulate a system based on our predictions, and then see if the results match our expectations. Let's return to the example of Dr. Ignaz Semmelweiss, who in the 1840's proposed that doctors wash their hands.

Testing Scientific Idea: Case Study
-
- Idea/Hypothesis: Handwashing by physicians before helping with childbirth, will decrease the number of women who die from infections (known as childbed fever)
- Expectation/Prediction: Doctors who wash their hands will have more patients that survive
- Observation/Experiment: Dr. Semmelweiss instituted mandatory handwashing for all physicians before helping in the maternity clinic and recorded the total number of women who gave birth and the numbers of those who died during or after birth.
- Analysis: While the number of women who did well vs. those who died is useful, calculating a percentage gives a better idea of what happened. The mortality rate dropped from 18.3% to 1.2% and eventually to 0%
- Community: Dr. Semmelweiss spread the word about his discoveries, but the medical community didn't accept his results because it conflicted with their ideas of how disease was spread. It wasn't until Luis Pasteur demonstrated that germs could cause infections that Semmelweiss' ideas were rediscovered and promoted.
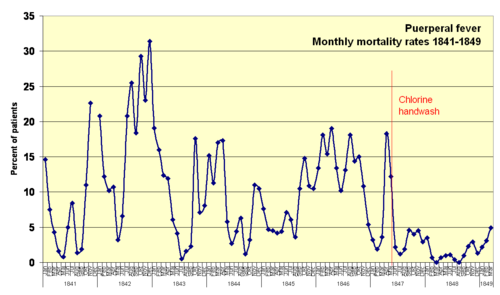
Puerperal fever monthly mortality rates for the First Clinic at Vienna Maternity Institution, 1841–1849. Rates drop markedly when Semmelweis implemented chlorine hand washing, mid-May 1847. (See rates).
Vocabulary
-
- Controls – things that are kept the same
- Variables – things that change
- Independent variable – what the experimenter changes between treatments
- Dependent variable – what the experimenter measures to answer the research question
- Treatment – one test group in the experiment. All members of a treatment are under the same conditions.
- Control treatment – a group with the default conditions, without the independent variable changed. This group will serve as a comparison for the experimental treatment.
- Experimental treatment – a group with the independent variable changed. The results from this group will be compared with the control treatment to see if there was a measurable difference.
- Confounding factor: this is anything that is alternate potential explanation of the results. Something that the researcher didn't consider and is skewing or biasing the results.
Guidelines to Creating a Good Experiment
In order to help you learn the process of testing ideas, we are going to work with microgreens and try to maximize our yield over the course of a month or so. Here are some guidelines that are important for creating good experiments.
-
- Test one variable at a time.
- Best to only alter one variable at a time. (either the position or the cleanliness of the physician, not both at once). Variable = some condition of your system that can be altered or manipulated to learn how the system works.
- Have more than one treatment group.
- A treatment is the group that all have the same experimental variable conditions. For example, all the women who were helped by physicians with washed hands would be the ‘cleanliness treatment’ and all those who were helped by physicians with unwashed hands would be the ‘unwashed treatment.’
- Have a control treatment.
- Best to have a control treatment where the conditions are unchanged– the experimental variable hasn’t been altered (in this case the unwashed hands).
- Compare control and experimental treatments.
- You then compare the control treatment group with the experimental treatment group (the cleanliness treatment) to see what effect your variable (cleanliness) had on childbed fever.
- Reduce bias; Your control and experimental treatment groups should be as similar as possible and only differ in terms of the experimental variable. For example, you wouldn’t want all young mothers in the cleanliness group and all older mothers in the unwashed group. This is called introducing bias. and introduces confounding factors.
- Another way to reduce bias is to have more than one sample per treatment group. In other words, you can’t just look at one woman with a clean physician vs. one other woman with an unwashed physician. Maybe one of those women is particularly susceptible or resistant to infections. The larger the sample size, the less chance for bias.
- Collecting Raw Data.
- You will need to have some way of measuring the effect of your experimental variable. In our example, Dr. Semmelweis recorded whether or not the woman came down with childbed fever. It is important that your raw data be a good reflection of what you are trying to test. For example, he could have recorded the survival rate of the children at 1 year of age. But survival to the first year is a product of not just survival at childbirth, but all the risks the child encounters in daily life.
We are now going to apply this information in working with our microgreens. But first, let's double check your understanding by taking the quiz.