3.6 - Population Characteristics of North America
Instructor's Video Links to an external site.
Gender and Fertility
The number of children the average woman will have in her lifetime (the fertility rate) has been declining in North America since the 1880's. In 1900, the average family size, including parents was five, today it is about 2.5. This has happened in response to increasing economic development, improved health care, urbanization, and more women participating in the workforce.
 As early as the 1800's, small numbers of North American women were starting to work in urban factories. As more women chose this path, the fertility rate fell steadily from a high of seven births per woman in 1800 to three births per woman in the 1920's. There was a rapid rise in the fertility rate following WW II, followed by a sharp fertility decline as North American women worked more and gained access to birth control in the 1960's. Since a low in the 1970s, North American fertility rates have remained flat, at a level just below replacement level, contributing to an overall aging of the population.
Aging in North America
The aging North American population is a result of longer life expectancies and a declining fertility rate. In 1900, 1 in 25 people was over the age of 65; by 2017, the number was 1 in 7. By 2050, it is likely that 1 in 5 North Americans will be elderly.
An aging population raises some concerns about the financial burdens the elderly may pose. In response, the US has raised the legal retirement age (when you are eligible of social security) to 67. Those arguing in favor of this change believe that if those over 65 remain self-supporting longer, there will be more working people spending their incomes and creating jobs. Critics point out that this approach disproportionately hurts lower income people, who have lower life expectancies and tend to retire earlier than wealthier people. Canada reversed its plan to raise the retirement age to 67 in 2016 based on this argument.
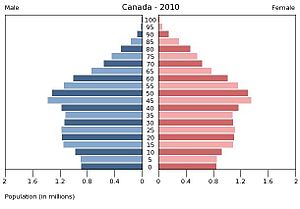
The "baby boomers" (those born between 1947 and 1964) constitute the largest age group in North America, as indicated by the bulge in the upper third of these pyramids. The "echo boom" or the millennials are indicated by the the lower bulge on these diagrams. These pyramids reflect the relatively low growth seen in both countries.
Population Distribution
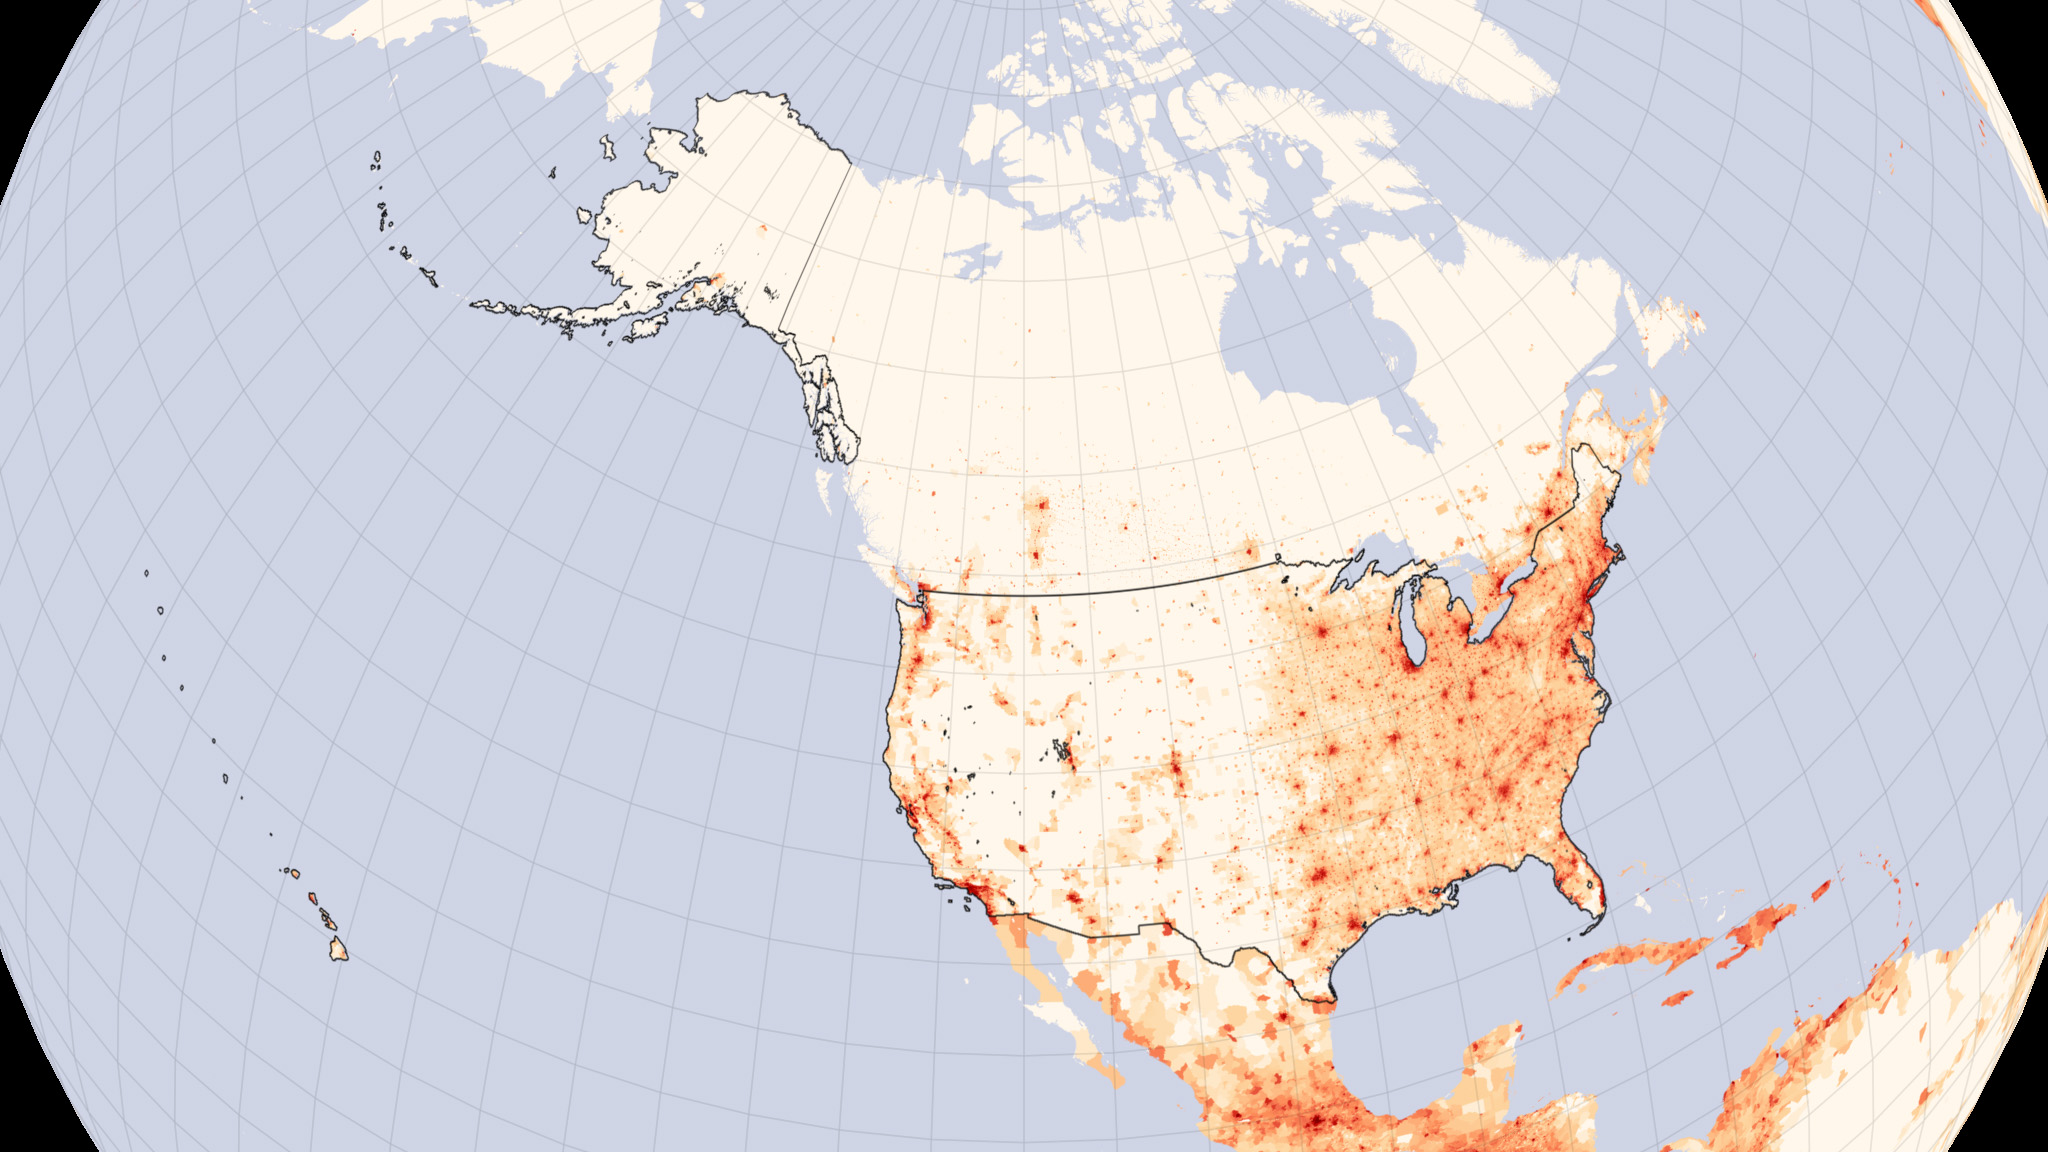 The distribution of the 362 million people who live in North America is quite uneven. Canadians make up just over one-tenth (37 million) of North America's population. They live primarily in southeastern Canada, close to the border with the U.S. The population of the U.S. is more than 325 million. The Northeast and the Mid-West are expected to grow more slowly than the South and West. Canada predicts a similar pattern of western and southern movement. 80% of North Americans live in cities. Since 2010, the South has been home to the United State's fastest growing counties.
North Americans are the most mobile people in the world. Every year 1/5th of the US population and 2/5s of Canada's population relocate. Some are changing jobs and moving to new cities; some are attending University or are retiring to new places; and others are just moving across town or to the suburbs or countryside.
The rate of natural increase in North America, 0.4 percent per year, is low, less than half the rate of the rest of the Americas, 1.2 percent. Still, North Americans are adding to their numbers fast enough through births and immigration that the population could reach 401 million by 2030 and 445 million by 2050.
Education
) In Canada,, school attendance is mandatory until the age of 16 in all provinces except for Manitoba, Ontario, and New Brunswick where the required age is 18. Kindergarten is available to children when they turn four in Ontario and Quebec and when they turn five everywhere else. There is no federal education department or educational system. The provincial governments manage and oversee public education within the provinces at all levels of education and receive funding from the local, provincial and federal governments. French immersion programs are offered in most places throughout the provinces as Canada is officially a bilingual country.
In Canada,, school attendance is mandatory until the age of 16 in all provinces except for Manitoba, Ontario, and New Brunswick where the required age is 18. Kindergarten is available to children when they turn four in Ontario and Quebec and when they turn five everywhere else. There is no federal education department or educational system. The provincial governments manage and oversee public education within the provinces at all levels of education and receive funding from the local, provincial and federal governments. French immersion programs are offered in most places throughout the provinces as Canada is officially a bilingual country.
Nationally, Canada performs better than the Organization for Economic Cooperation and Development (OECD) average in all graduation numbers. In 2018, the share of adults in Canada with at least a minimum of high school education was around 92 percent. Canada also led the world in 2016 in percentage of the adult population that had a tertiary education (a bachelor’s degree or higher) with around 62 percent of those aged 25 to 34 years with a tertiary education. On the provincial and territorial level, British Columbia scored the highest on percentage of the population with at least a secondary education at 93 percent, while Nunavut was a distant last with only 58 percent of the adult population having graduated high school.
Education in the United States is provided in public, private, and home schools. State governments set overall educational standards, often mandate standardized tests for K–12 public school systems and supervise, usually through a board of regents, state colleges, and universities. $1.3 trillion is spent on education in the US and the bulk of that funding comes from state and local governments, with federal funding accounting for only about $200 billion.
In 2020, over four-fifths (85 percent) of all US adults 25 years or older reported they had completed at least high school, or obtained a GED/high school equivalency certificate. Over one in four adults (27 percent) had attained at least a bachelor's degree. Both of these measures are all time highs. In 2003, the percentage of the adult population who had completed high school or had not completed high school but obtained a GED increased for the first time since 2000, when it was 84 percent.
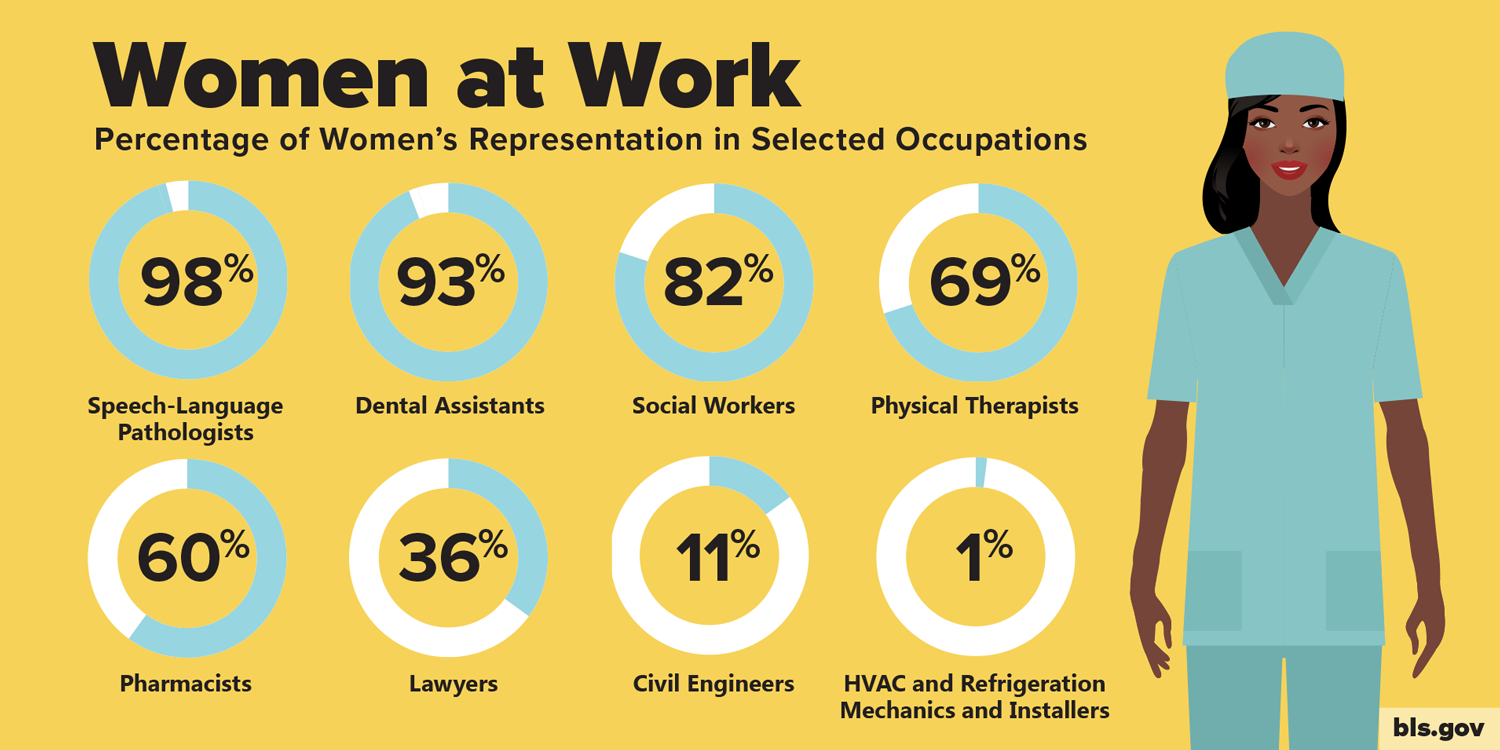
In both Canada and the United States more women than men graduate from high school, complete bachelor degrees, masters degrees , PhD's and professional degrees. Men retain a slight margin over women in engineering and physical sciences.